Organizing & Summarizing
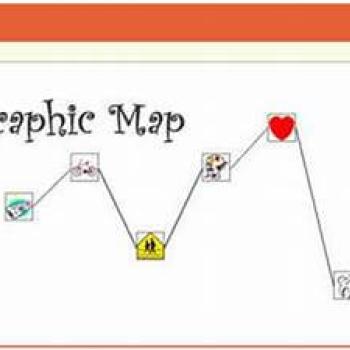
Graphic Map
Grades
3 - 12
About this Interactive
Overview
The Graphic Map is designed to assist teachers and students in reading and writing activities. The organizer focuses on charting the high and low points related to a particular item or group of items, such as chapters in a book, amounts of money spent, events during a day, month, year, or life, or scenes in a play. The Graphic Map creates a graphic representation of these high and low points that displays related images and descriptions. The interactive can be used as a prewriting activity, as students map ideas for an autobiography; as a postreading activity, as students map the significance of events in a story; and as a reflection and assessment activity, as students map the high and low points of their inquiry process.