Timeline
About this Interactive
Overview
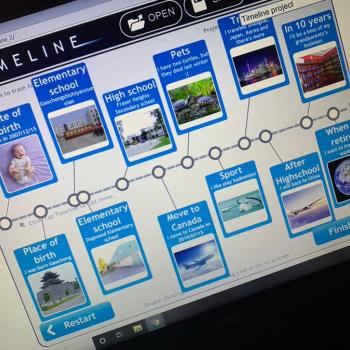
Timeline allows students to create a graphical representation of an event or process by displaying items sequentially along a line. Timelines can be organized by time of day, date, or event, and the tool allows users to create a label with short or long descriptive text. Adding an image for each label makes a timeline more visually appealing.
Add, drag, and rearrange items as needed. Saving capability allows students to return to their work and make revisions, and they can share their final work via e-mail.
Related Resources
- Student Interactives |
- Lesson Plans |
- Calendar Activities |
- Printouts
The Graphic Map assists teachers and students in reading and writing activities by charting the high and low points related to a particular item or group of items, such as events during a day or chapters in a book.
The Plot Diagram is an organizational tool focusing on a pyramid or triangular shape, which is used to map the events in a story. This mapping of plot structure allows readers and writers to visualize the key features of stories.
The old cliche, "A picture is worth a thousand words" is put to the test when students write their own narrative interpretations of events shown in an image.
To prepare students for reading the graphic novel Persepolis, this lesson uses a WebQuest to focus students' research on finding reliable information about Iran before and during the Islamic Revolution.
Students compose a multigenre paper, modeled after the Delany sister's autobiography, Having Our Say, that includes the autobiographical narrative essay as well as an informational nonfiction piece.