Students research careers of their own choosing. Then using Piktochart, students create their own infographics to illustrate their research.

Sharing Information about Careers with Infographics
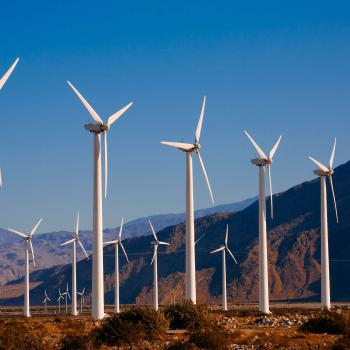
Getting Graphic with Alternative Energy Sources
After researching alternative sources of energy, students create online comic books to present their information.

Fashion Fun with Fossil Fuels
After researching specific fossil fuel issues, students create their own clothing brands that express their opinions about the issues and then share their information and clothing line using either PowerPoint or Prezi.

Poppin' Fun with Physical and Chemical Changes
Students will enjoy learning about physical and chemical changes as they turn their own photos into a narrated video using the iPad app SonicPics to illustrate (and eat) their results from a popcorn lab.
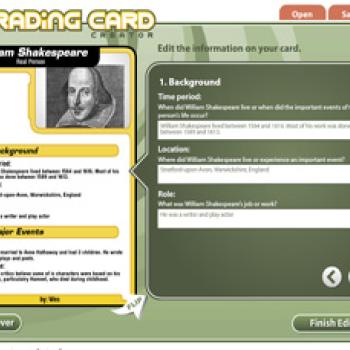
Trading Card Creator
This tool provides a fun and useful way to explore a variety of topics such as a character in a book, a person or place from history, or even a physical object. An excellent tool to for summarizing or as a prewriting exercise for original stories.

Finding Solutions to Food Waste: Persuasion in a Digital World
Using various reading strategies and resources, students explore the issue of food waste. They also create persuasive arguments and blog posts examining this topic.

Celebrate Digital Learning Day today.
Students reflect on recent learning and the role digital tools and media have played in supporting or enhancing it.